St. Louis County, Missouri Creates a Line Tracking App
This spotlight was featured in our ELECTricity newsletter in May 2021. Sign up to receive more success stories from election offices across the country.
Election officials are continuously implementing innovative ideas to prevent long lines from forming on Election Day. After all, shorter wait times mean happier voters and less stress on poll workers, so it’s a win-win situation. Recently, we shared how election officials are using tablets and e-poll books to reduce wait times. Today, we’re highlighting how St. Louis County, Missouri created a line tracking app to better serve their voters. In 2020, they became the first county in the state to provide live estimates for wait times at polling sites.
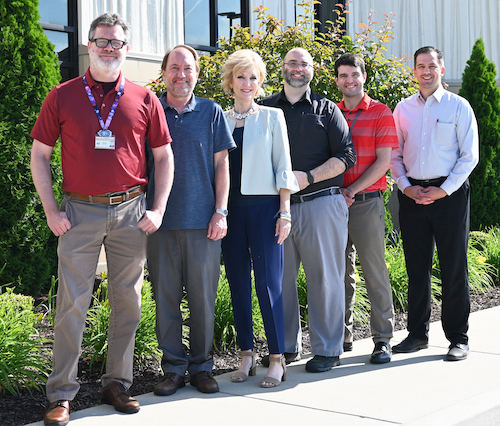
Eric Fey is the Democratic Director of Elections for St. Louis County, Missouri. It’s the state’s most populous county, where voters are sometimes lucky enough to encounter goats at their polling places. You might recognize Eric from the election administration podcast, High Turnout Wide Margins, where he co-hosts with Brianna Lennon from Boone County, Missouri. Our Executive Director, Tiana Epps-Johnson, recently appeared on the show, and we recommend giving it a listen.
Adapting to the COVID-19 Pandemic
As Eric and his team were gearing up for the March 2020 primary election, the COVID-19 pandemic hit. Suddenly, poll workers and polling places began cancelling, and the folks at St. Louis County’s election office found themselves with fewer resources to serve voters on Election Day. “We realized that we needed to be more nimble in order to respond quickly to the uncertainty of running elections during a pandemic,” Eric reflects. That’s why they decided to implement a “vote anywhere” option for the June and August elections. This allowed voters to vote at any polling place in the county.
According to Eric, it is normal for 90% of their voters to cast their ballots in person on Election Day. He says St. Louis County voters are familiar with waiting in long lines, and the frustration associated with those lines. Voters found the “vote anywhere” option to be convenient in June and August, but the Board of Elections wanted to make even more improvements for the November election. For instance, they wanted to allow voters to see the wait times at each polling place in real-time. That way, they could make a better decision about where and when to vote. When St. Louis County’s election office received CTCL’s COVID-19 Response grant funding, they purchased software to do just that.
Setting up the Line Tracking App
The team in St. Louis County decided to create a website where voters could easily visualize various polling places near them. The site would include wait times for each polling location, updated in real-time. In order to accomplish this, they used an application from the geographic information system (or GIS) software company, Esri. Essentially, the GIS software uses information about geographic location to create digital maps, like the ones you might see in Google Maps. Bill Hartnett and Rob Ryan are experts in mapping and GIS at the St. Louis County election office, and were responsible for setting up the app. Over the past several years, they had been educating themselves on the most up-to-date Esri applications. So when the time came to develop this app using Esri’s Survey123 app, they were able to get it up and running in just three days.
Prior to Election Day, Eric and his team loaded the Survey123 app onto smartphones and sent them out to each polling place. It’s worth noting that Eric says this was the most labor intensive part of the project. Once they finished distributing the smartphones, the polling places were ready for voters.
Using the App on Election Day
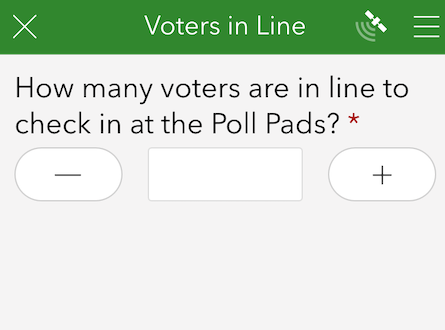
On Election Day, high school student volunteers and poll workers would count the number of people in line every half hour. Then, they would use the smartphones to enter the number of people in line into the Survey123 app. “We wanted this to be as simple as possible for the polling place workers,” says Eric. As soon as poll workers entered the information into the app, employees received it back in the election office. Then, the Polling Place and Sample Ballot Look Up website would update with the new data from the app. This way, the wait times for each polling place on the website were up-to-date.
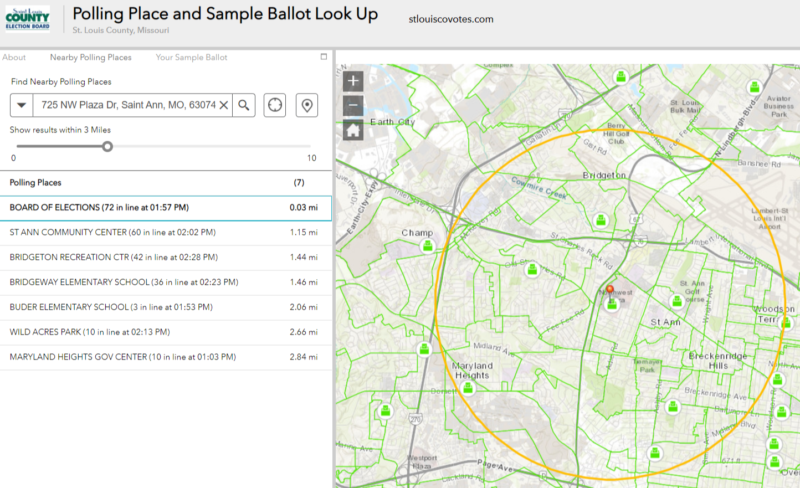
The website, which features an interactive map, is both dynamic and user-friendly. Voters can type in their address to view the wait times at the polling locations closest to them. They can even view a sample ballot. This intuitive system helps voters plan ahead of time, so that they’re able to move through the line quickly and confidently on Election Day. In this way, the app serves to reduce crowding at polling sites and ease the burden on poll workers.
Getting the Word Out to Voters
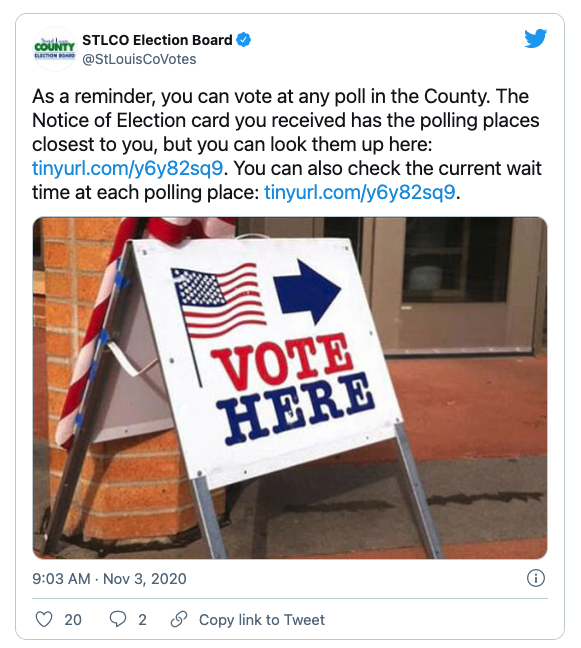
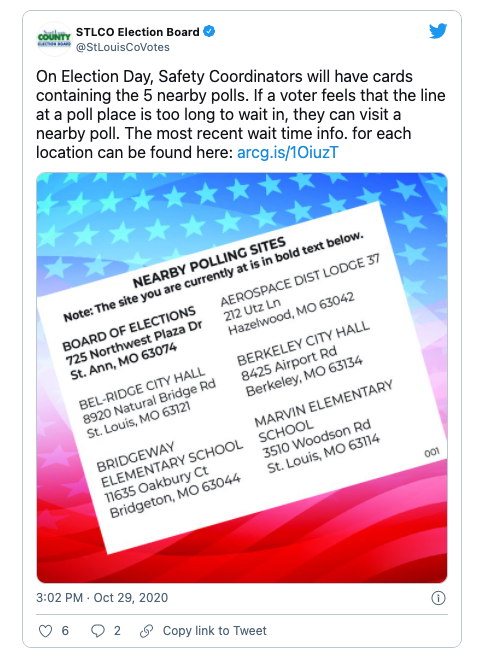
After launching the app, members of the election office needed to raise awareness among voters to encourage them to use it. Prior to each election, they send an election notice with a sample ballot to each voter. Leading up to the November 2020 election, they also included a list of the five closest polling places to the voters’ home precinct. The mailer included the line tracker’s web address if they wanted to seek out a shorter line. “We saw many voters bring this with them to the polling place,” says Eric. The office also used social media and digital advertising to raise awareness of the new initiative.
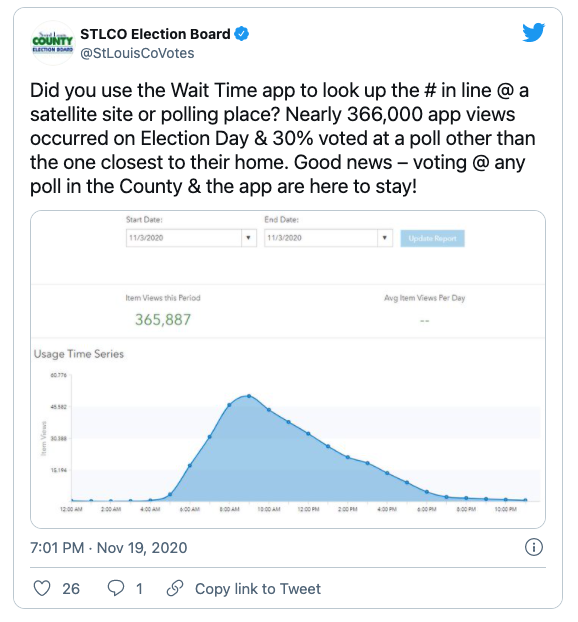
These efforts to get the word out paid off. On Election Day in November, the app was viewed 365,887 times, and 30% of voters cast their ballots at a polling location other than the one closest to them. Notably, 85% of in-person voters cast their vote prior to 4:00 p.m., resulting in polling places with short or no lines when polls closed at 7:00 p.m. “For voters who utilized the line tracker it was very liberating,” claims Eric. In addition to the impressive statistics, members of the election office also received positive anecdotal feedback from voters, including a local elected official. “He told me that he checked the website before he left to vote to select a polling place with a short line. He said he had to drive a few minutes farther than normal, but he was in and out in a matter of minutes on a presidential election,” Eric recalls.
Planning for the Future
For future elections, St. Louis County hopes to use data from the line tracking app to fine tune their efforts. “We can see from the website hits when the greatest demand existed for the information,” Eric explains. “From that we might be able to better time social media posts or provide additional staffing to certain polling locations.” They also plan to keep an eye on if and how voters use the website for elections with lower turnout and shorter lines.
St. Louis County’s election office implemented this new project just before the November election. The app is simple to use, but still there was a bit of a learning curve due to the last minute implementation. So for future elections, they plan to train poll workers to use the line tracking app well ahead of time. “We’re confident that this will become second nature for poll workers once we use it for several elections.”
Using GIS in Your Election Office
St. Louis County’s line tracking app is just one example of the ways that GIS software can streamline election processes. It can also help ensure that voters are placed in the right voting district, receive the correct ballot, and vote in the appropriate contests. Many election offices go through tedious processes, like using colored pencils to map out jurisdictional boundaries. GIS technology allows election officials to visualize voters and voting district boundaries much more efficiently. Plus, election officials can use GIS data to prepare for redistricting efforts and audits. Eric says his office also uses GIS for polling place surveys and asset tracking. The possibilities are endless.
If your election office is able to obtain the resources necessary to implement GIS software, Eric says it can really make a number of business processes more efficient. As an important first step, Eric recommends convening a team of experts who can commit to continuous improvement. “We wouldn’t have been able to implement this program if our GIS employees hadn’t been attending seminars and trainings on a regular basis to know this capability existed,” he shares. Eric recommends working with another governmental agency or university. You might consider cooperating with college students looking for real world projects and experience. “If you dip your toe in the water that way it might lead to something more at some point,” encourages Eric.
If you have any questions about St. Louis County’s line tracking app, you can reach out to Eric at [email protected].
Additional Resources
Would like to learn more about how to begin using GIS in your election office, or how to take your GIS skills to the next level? We are currently hosting a training series, Geo-Enabling Elections, on Thursdays through June 3rd. If you’ve missed our earlier training sessions, stay tuned for our self-paced course going live this summer. You can sign up to receive our monthly ELECTricity newsletter, which includes training updates.
And for more information about how to reduce wait times for voters, check out our polling place resource planner. This free tool can help you run a simulation to predict how busy polling places will be, and thus anticipate voters’ needs.
If you missed the first two newsletters in this series on reducing wait times, you can check them out here:
